Each year, we typically sign up over 6 million new customers for the Retirement, Survivor, and Medicare programs. We're committed to ensuring that our customers get their payments or coverage promptly.
Set a strategic goal.
Process 83% of Retirement, Survivor, or Medicare claims in time for payment at the earliest point due (or within 2 weeks of filing for benefits if filed too late for payment at the earliest point due).
Drive leading actions.
Encourage more customers to use SSA.gov to enroll and complete other common tasks. This will free up field office staff to focus on customers who need more help.
Track Key Performance Indicators (KPIs) over time.
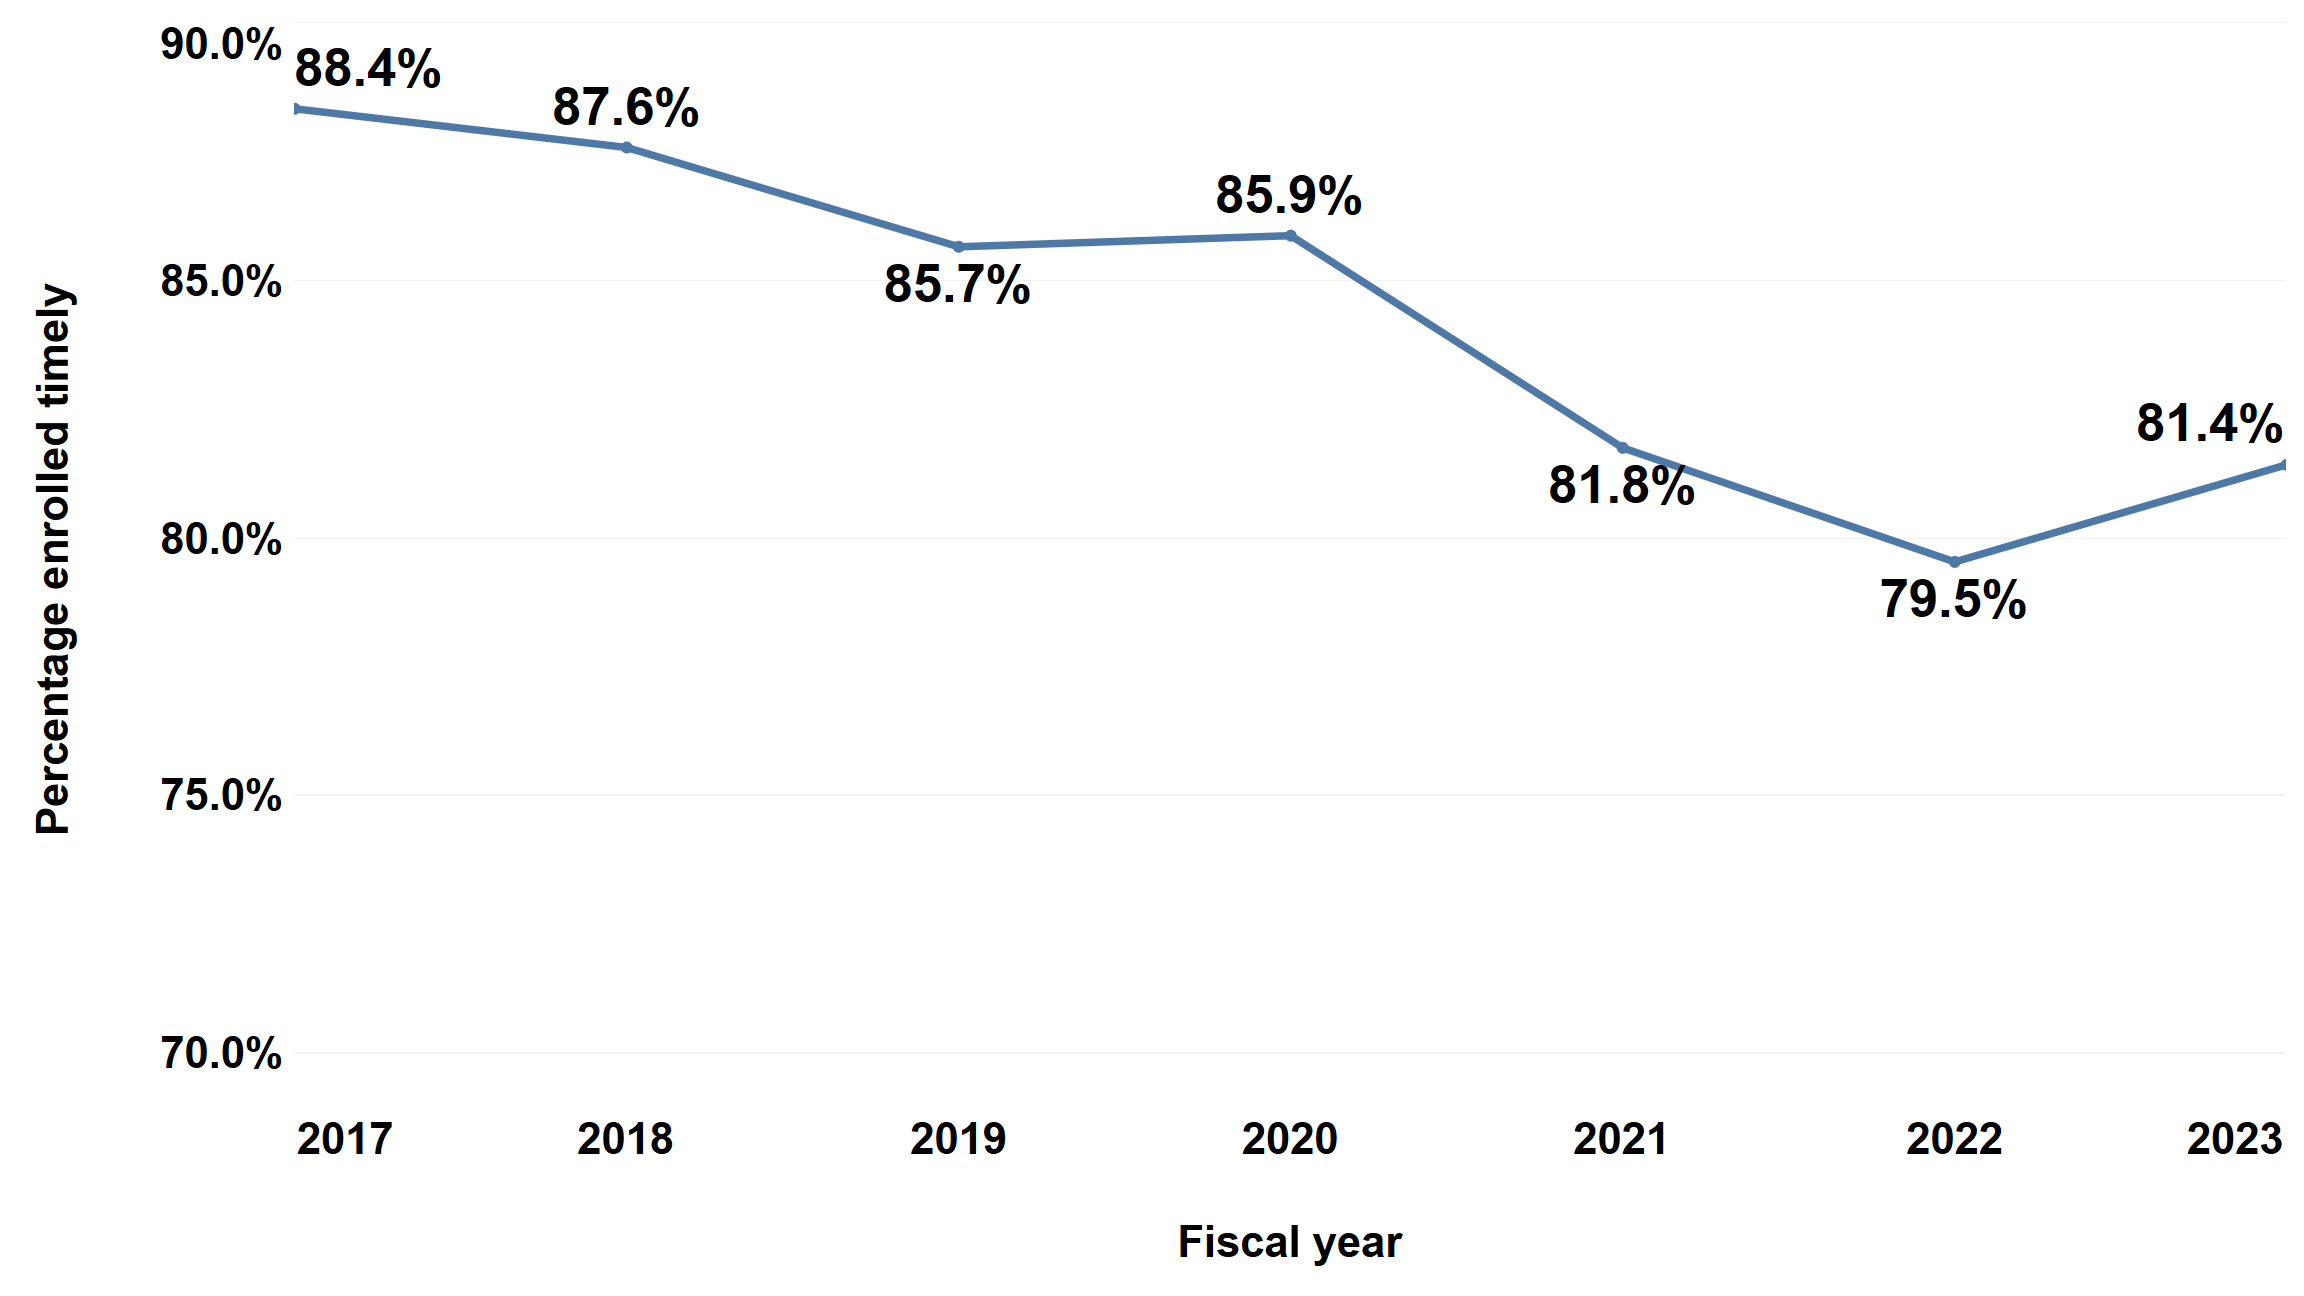
Percentage of people getting benefits on time or within 2 weeks of applying

The percentage of on-time receipt of benefits is different than the average time it takes to complete a Retirement, Survivor, or Medicare application. This chart doesn’t include people seeking Disability Insurance or Supplemental Security Income benefits. Those programs have separate, longer application processes. From fiscal years 2017 to 2023, the percentage of benefit claims processed timely decreased by 7 percentage points, while the number of benefits we processed increased by 19%. We had less staff to process claims in fiscal years 2021 and 2022.
This chart doesn’t include people seeking Disability Insurance or Supplemental Security Income benefits. Those programs have separate, longer enrollment processes.
Heat map of the United States and territories showing percentage of Retirement, Survivor, and Medicare claims processed timely by local field office for fiscal year 2024. Approximately half the areas show timeliness above 83%." width="1200" height="675" />
This map shows fiscal year 2024 performance to date for each of our more than 1,200 local field offices.